Accessing In-Platform Reports (for Non-Shape Users)
Company-Level In-Platform Reports
To help clients and internal team members understand how PPC campaigns are doing, PPC advertisers often add context to their performance metrics by including past and present data. By comparing historical data to the present, marketers are able to show how campaign performance has improved (or declined) due to factors such as campaign optimizations, industry trends, and seasonality.
The only problem?
Without a solution for report automation such as Google Data Studio or a third-party software, collecting historical and current data can be extremely manual and cumbersome. For these PPC agency reports, data has to be collected across each advertising platform for each client and data set needed. If you need to adjust the date ranges you’re comparing after the fact then you'll need to manually repull all that data.
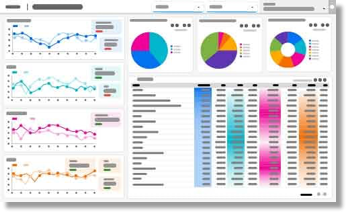
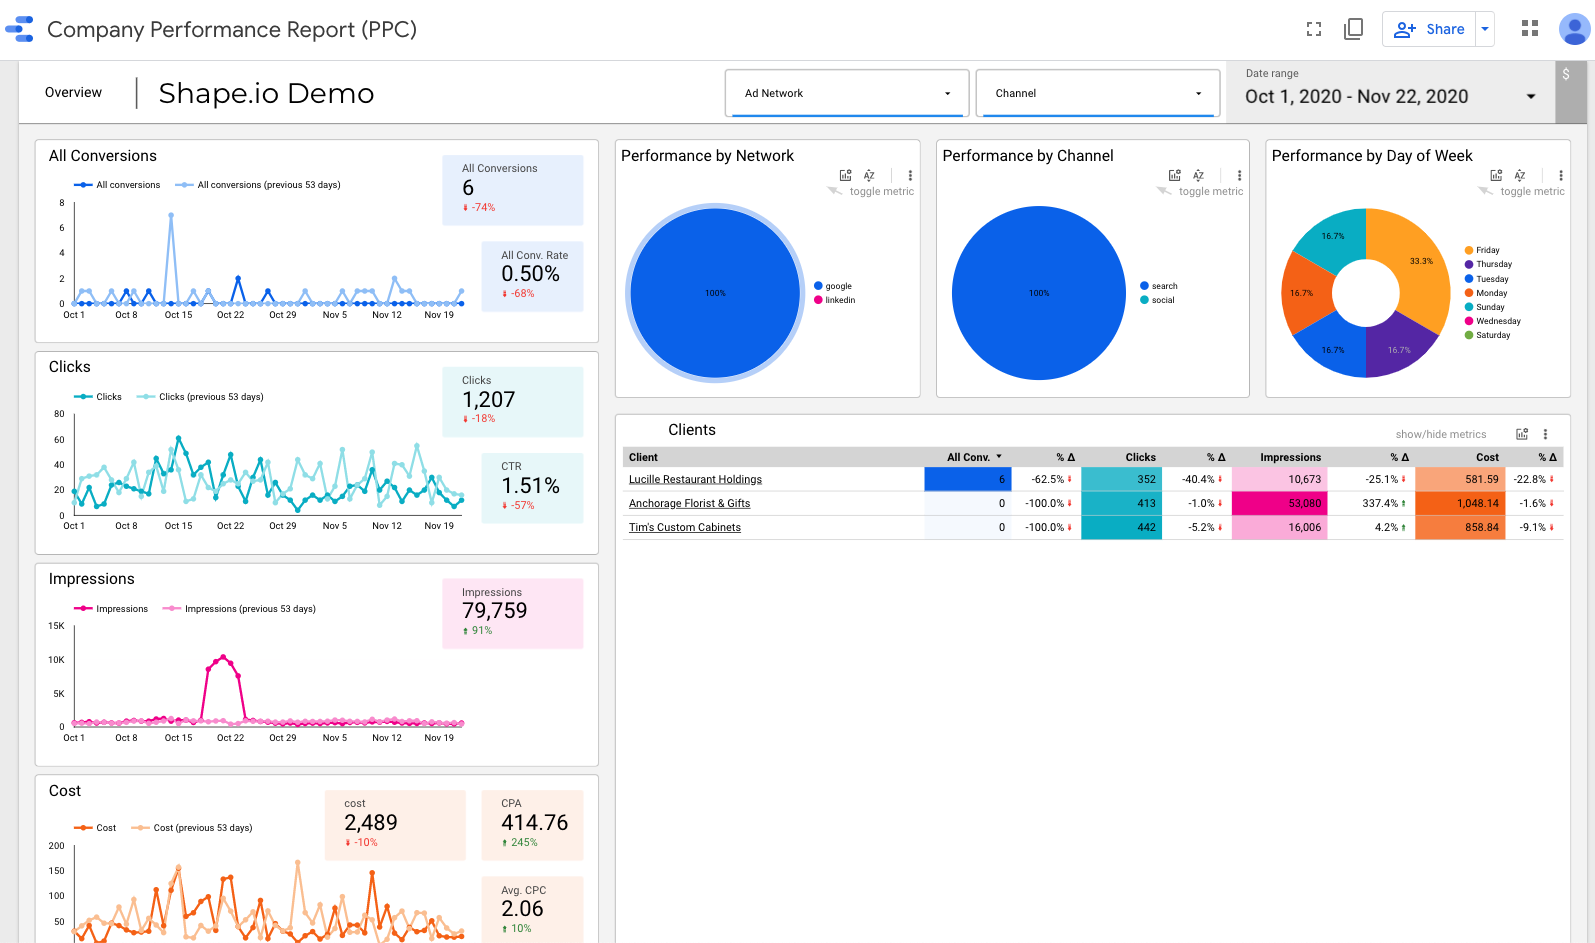
To make comparing Clients’ historical and current performance metrics simple and fast, Shape rolled out our Company Performance Report as part of our new In-Platform PPC Reporting launch. The Company Performance Report displays current and historical PPC performance data for all Clients in Shape. The Client Performance Report is also dynamic so when a viewer selects a past date range, the report will automatically refresh to allow him/her to view that historical performance data.
By completing three simple steps, you can launch a Company Performance Report with all your clients’ performance data in under a minute.
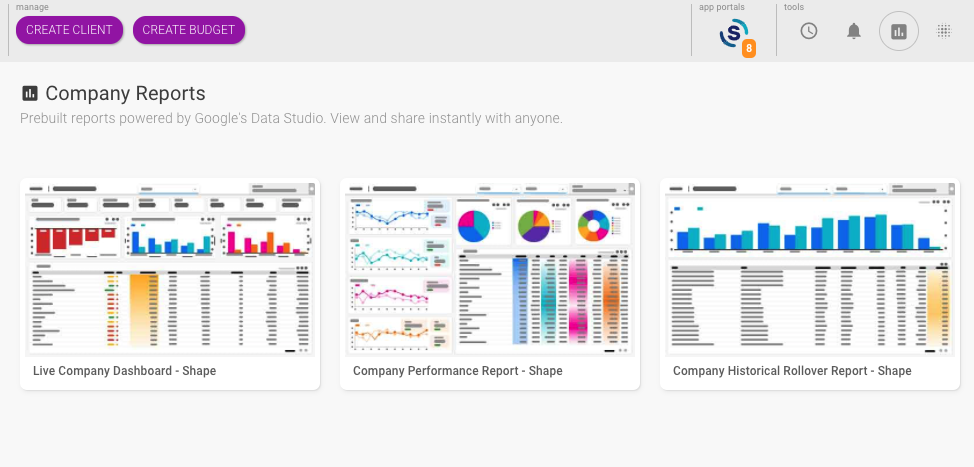
Shape’s PPC agency reports, including the Company Performance Report, display all of the active clients you have in Shape. The other company-level reports include the Live Company Dashboard and the Historical RollOver report.
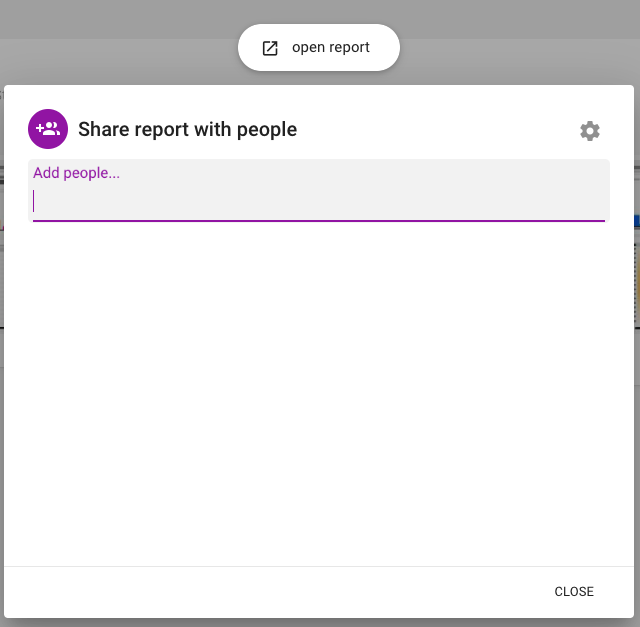
This report is designed to be shared internally with other members of your company who do not have access to Shape. Note that if you share this report with a Client they will have access and insight into your other Clients’ performance metrics.
The Company Performance Report is not only useful in understanding your clients’ current top-level performance but how these metrics compare historically. Comparing current data to past dates ranges makes it easier to identify (and course-correct) performance anomalies that may be impossible to spot otherwise. For example, while a certain KPI (such as CPA or conversion rate) may meet your expectations for a given week or month, long-term problems may be lingering. The Company Performance Report can help highlight bigger problems such as if a KPI was down 50% quarter over quarter.
Finally, if you do see major shifts in certain performance metrics, this report can be useful in diagnosing whether it has a wide-scale impact across all your Clients or is limited to a few outliers.
DIRECTIONS TO LAUNCH YOUR OWN PPC AGENCY REPORTS