Build Automated PPC Reporting with Shape ADI

automated ppc reporting

Agree on Reporting Goals

It may feel unnecessary to set goals before creating your automated PPC reporting system. But, getting upfront agreement on high-level deliverables and how “success” will be measured will save headaches and hard conversations in the long run.

ppc goals

First, define why you are automating reporting. Is your company looking to:

  • Reduce or eliminate time employees spend reporting
  • Reduce or eliminate third-party software costs
  • Provide an internal-only or a public-facing reporting dashboard
  • Improve client communication and/or increase product adoption
  • Identify PPC performance optimizations faster
  • Address other company PPC data needs (ex: accounting reconciliation)

It’s important to get all internal stakeholders in relative agreement (you’ll likely never get 100%) on your reporting goals and deliverables. Otherwise, you might be sorely disappointed when the grand vision you have for a client-facing, interactive reporting dashboard is built as a simple .CSV table generator.

Similarly, defining your product goals will help you determine what metrics you’ll use to measure the success of the product. Building a client-facing dashboard? You may want to measure metrics such as adoption rates and the time clients spend viewing reports. Did you build a custom reporting engine that replaces your third-party software and improves employee efficiency? Success could be measured in annualized saved software costs plus employee time savings vs. the cost to engineer and implement a custom reporting solution.
Define Your Reports

Once you’ve agreed on goals and top-level deliverables, it’s time to get into the details. Defining your reports includes scoping out how many reports you need, what data you need, and how you want your reports to look. Good questions to consider as part of this process include:

  • Do you have existing reports you want to replace?
  • Are you building new report templates from scratch?
  • Do you need different reports for different stakeholders (executives, customer success managers, accounting departments, clients)?
  • What questions do your reports need to answer? For which stakeholders?
  • What ad platforms do you need data from?
  • What metrics/dimensions do you need? What metrics/dimensions do you want?
  • Do you need to combine data from ad platforms with other sources (ex: Analytics platforms)?
  • Do reports need to be shareable? White-labeled?
  • Will you display data tables or charts, graphs, and images too?
  • Will you report on preset time frames or allow customization?
  • Does your team need the flexibility to create ad hoc reports on the fly?

If you’re stumped, there are many free online report templates to get inspiration from. Whether you design your ideal reports on paper, a whiteboard, in mockup software, or in Data Studio, it’s time to get the data and get building!

Get the Data

Previously, digital advertising teams that needed automated access to cross-channel PPC data had to implement costly PPC management/reporting software or build their own reporting systems using costly-to-maintain API integrations.

ppc data pipeline

But, solutions such as Shape’s Advertising Data Infrastructure have emerged to take on the heavy lifting of collecting, normalizing, storing, and transferring cross-channel PPC data in a fully-managed marketing data warehouse. Shape’s ADI makes historical and current PPC data available almost immediately, giving digital advertising teams a head start building reports and tools.

Since systems like Shape’s ADI and many other data connectors collect and store data daily, this means up-to-date data will be available to send to the reporting solution of your choice. Reporting systems such as Google Data Studio can be set up to automatically refresh data when you or a stakeholder opens a report taking you a step closer to fully automating your PPC reporting process.

We’ve outlined the simple steps to get PPC data from up to five ad platforms and seven ad networks flowing into a PPC data warehouse below:

    1. Sign up for Shape.


    2. During the onboarding process, add your Google Ads (incl. Youtube), Facebook Ads (incl. Instagram), Microsoft Ads, Twitter Ads, and LinkedIn Ads.


    3. Optional: Create Clients and Budgets in Shape. You can combine campaigns into unique groupings to track spend and metrics in whichever combinations you choose.


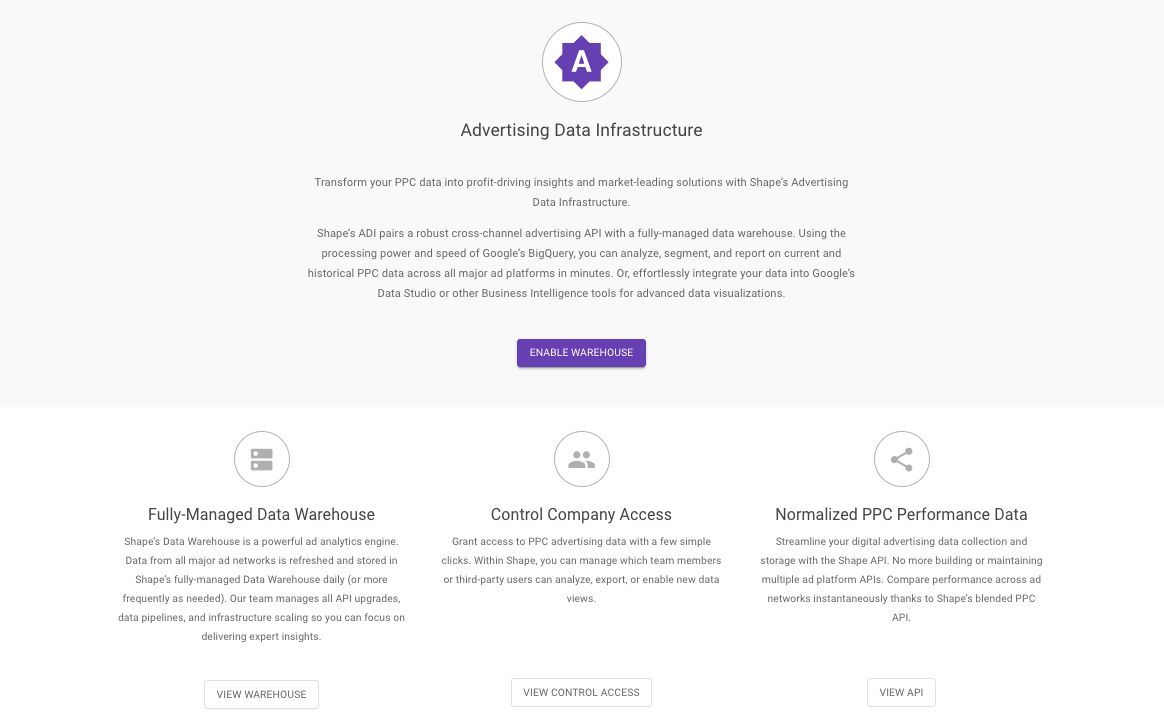
    4. On the main dashboard, click ADI. On the ADI page, click “Enable Warehouse.”

    Shape advertising data infrastructure interface showing where users can enable a new data warehouse

    5. Shape will automatically generate a BigQuery data warehouse for you and enable five always-free campaign-level data views.


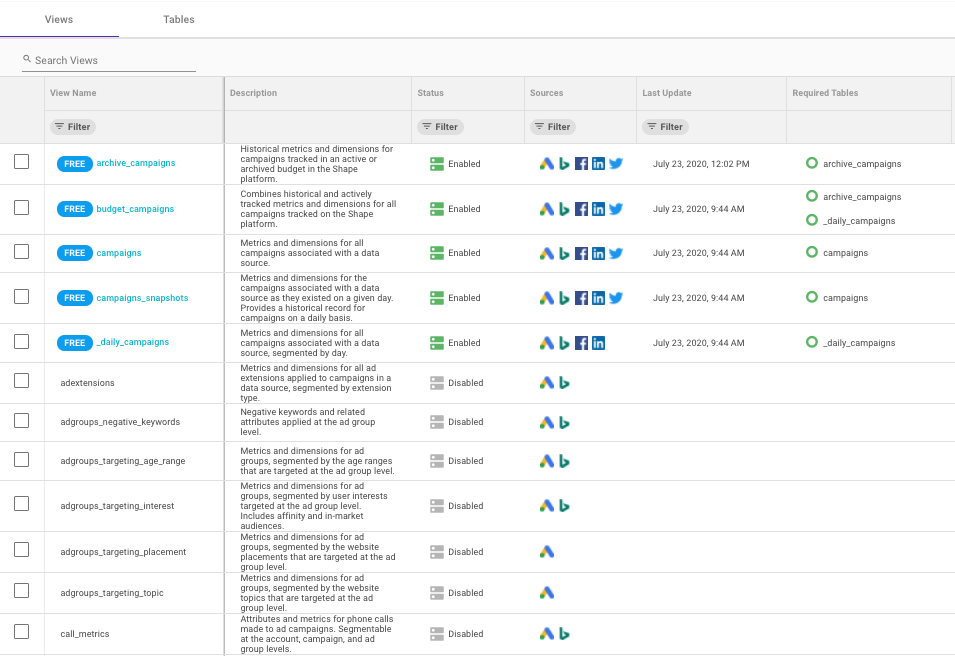
    6. Once your data warehouse has been generated and 30-days worth of data backfilled, you’ll be taken to your company's Data Warehouse that lists all available data views.

    Shape advertising data infrastructure interface showing where users can enable data views

    7. Enable new views by clicking the checkbox next to the View name and then on the pencil (edit) icon. Switch Status to Enabled.


    8. For each new view you turn on, data will be populated and backfilled.


    9. From the Data Warehouse page, you can link directly to Google BigQuery or Google Data Studio. Click on the view name and the select “Open in BigQuery" or “Open in Data Studio.”


Build PPC Reports in Data Studio

Google Data Studio’s functionality has advanced significantly in the last two years making it an excellent option as a PPC reporting tool. However, if your plan is to use a business intelligence tool or code your own customized platform for reporting, Google Data Studio is still a great place to prototype reports.

If you’ve never built a report in Data Studio, we highly suggest familiarizing yourself with Google’s comprehensive Data Studio help guide. It provides tips on building, stylizing, and sharing reports. We offer our Shape Data Studio help guide as well that outlines how to build reports from our free templates as well as from scratch.

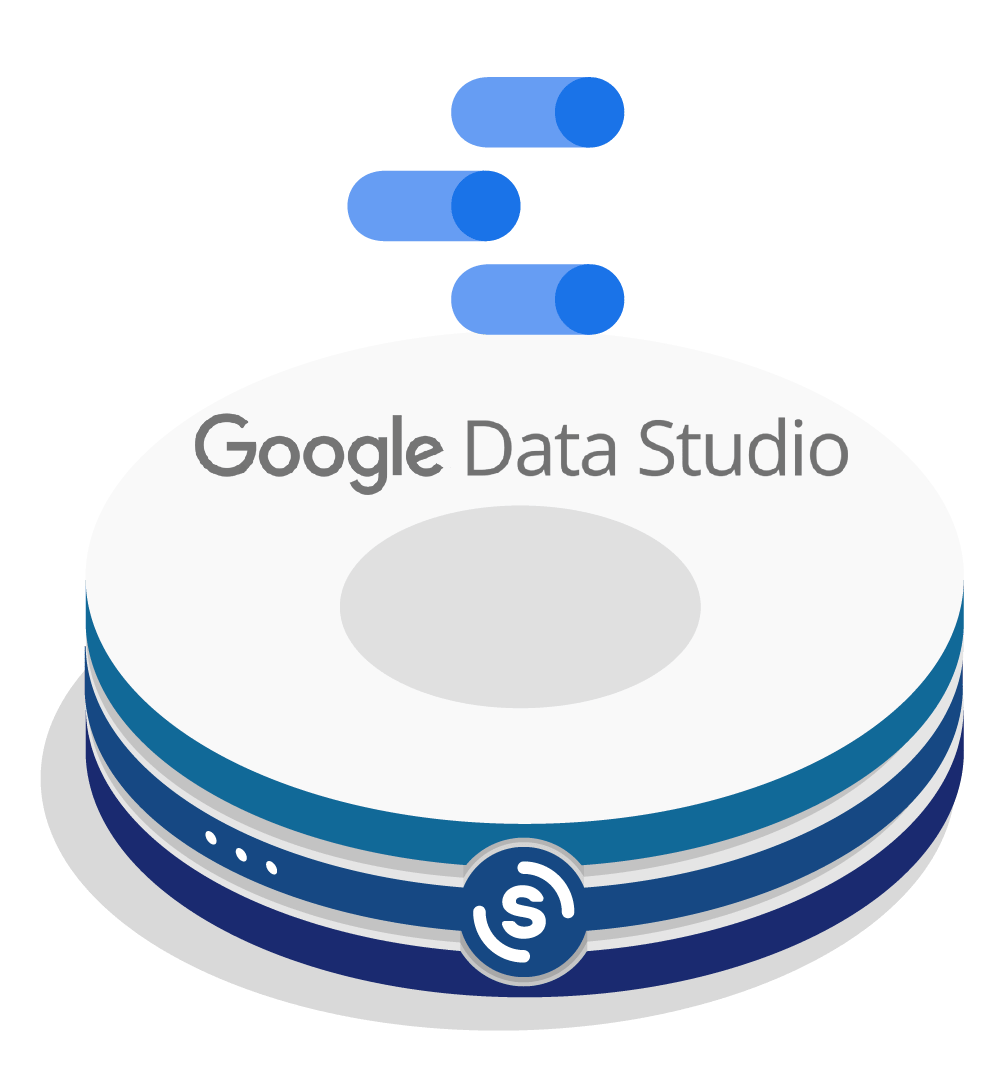
Google Data Studio logo hovering over Shape Advertising Data Warehouse logo

Shape offers 35+ data views, including five always-free, campaign-level views. To get started building tables, charts, and graphs, find the View (or Views) that will best suit your needs. Detailed descriptions of each view can be found on the Data Warehouse page.

NOTE: For reports that you want to segment by day (or a specific date range) use Views with _daily_ in the name. The data in Views without _daily_ is rolling data for a predetermined set of time (See the “Change Data Refresh Frequency and Date Range" section in View Settings.)

To get PPC data flowing into your reports:

    1. Open Data Studio.


    2. Add one or more data Views to Google BigQuery depending on what reports you want to build.


    3. Click "+ Add a Chart" and select your desired chart/table/graph type.

    4. Click the box under “Data Source” to add the correct data source, or join data from two Views by selecting “+Blend Data.” Blending data requires you to join on at least one data field shared between two Views.


    5. Add Date Range Dimensions, Dimensions, and Metrics to your charts until you get the information desired.

    a. On the Data tab, you can add filters to refine data, sort data, and implement additional features to refine data shown. The Style tab allows you to stylize the way a chart looks.


    6. If you need to add additional data, images, or text, you can add additional pages by clicking “+Add a Page” then repeating step 3. Set page- or report-level controls using “+Add a Control.”


    7. We suggest waiting until you’ve solidified all the data, pages, charts, and filters you want before finalizing your overall report design. To do so, click on the report outside of any chart/table. Tabs to edit the Theme and Layoutf will appear in the right-side navigation.


Launch Reporting

If you’re utilizing Google Data Studio as your reporting platform, once you’ve built your charts and tables, finalized your design, and verified your data, it’s launch time!

Likewise, since Shape utilizes Google BigQuery as the data warehouse foundation for the ADI, you can also quickly and easily integrate and launch reporting with many business intelligence tools as well.

If your company is building its own custom PPC reporting solution, then it’s time to hand off the data and prototypes to your product and engineering teams (if you haven’t been working with them already). Since Shape handles PPC data integrations/updates, storage, normalization, and data warehouse infrastructure scaling, engineering teams can start building reporting interfaces almost immediately. And, if your team needs more functionality, including making optimizations to campaigns via your reporting system, Shape’s API enables two-way changes to ad platforms as well.

Bonus: Need more inspiration for marketing report templates and dashboards for your clients? Check out our partner NinjaCat's template gallery.

Share With Stakeholders

Animated image of handshake indicating that Shape is a trusted partner and consultant with agencies using Shape ADI

Whether you built your reporting system in Google Data Studio, a BI tool, or on your own platform, it’s time to share those reports.

While we suggest reviewing reports before they’re sent out to clients or stakeholders, most reporting solutions offer the ability to pre-schedule when you want reports to be shared.

Getting reports in front of stakeholders or clients can be scary, and you’ll likely receive feedback (good or bad). Keep in mind, reporting can and should be regularly evolving. Ad platforms will release new ad types and metrics over time, and to be competitive, you’ll need to update reporting as time goes on.

Start Building Reports with Shape’s Advertising Data Infrastructure

We believe that every digital advertiser should be able to build and customize reports across multiple ad platforms without requiring lengthy engineering projects. With Shape’s ADI, every digital advertising team has cross-channel PPC data and a powerful data warehouse right at his or her fingertips.

To help make it easier to report on and analyze your data, we have made campaign-level warehousing and API access free.

Looking for premium data Views or interested to learn more about what you can build with a data warehouse? Don’t hesitate to schedule a free consultation with our engineering team today before diving in.

Schedule a Call


Additional Reporting Connectors Offered in Shape's ADI Product Suite:

Read more from our blog:

PPC Management
Scaling and growing your ppc operations
Product Updates
Recent product related updates and information from the Shape team
Blog Home
Chronological feed of all posts